Trucking service costs can pose significant challenges for manufacturing, retail, construction, and small businesses. Understanding how these costs are determined is essential for effective budgeting and operational efficiency. With the shipping industry’s complexities, four primary factors influence trucking rates: distance and route complexity, vehicle characteristics, transportation methods and speed, and market demand influenced by seasonality. Each chapter will delve deep into these elements, offering readers a comprehensive understanding to help make informed decisions and optimize shipping costs.
Miles, Mountains, and the Hidden Toll: How Distance and Route Complexity Shape Trucking Costs
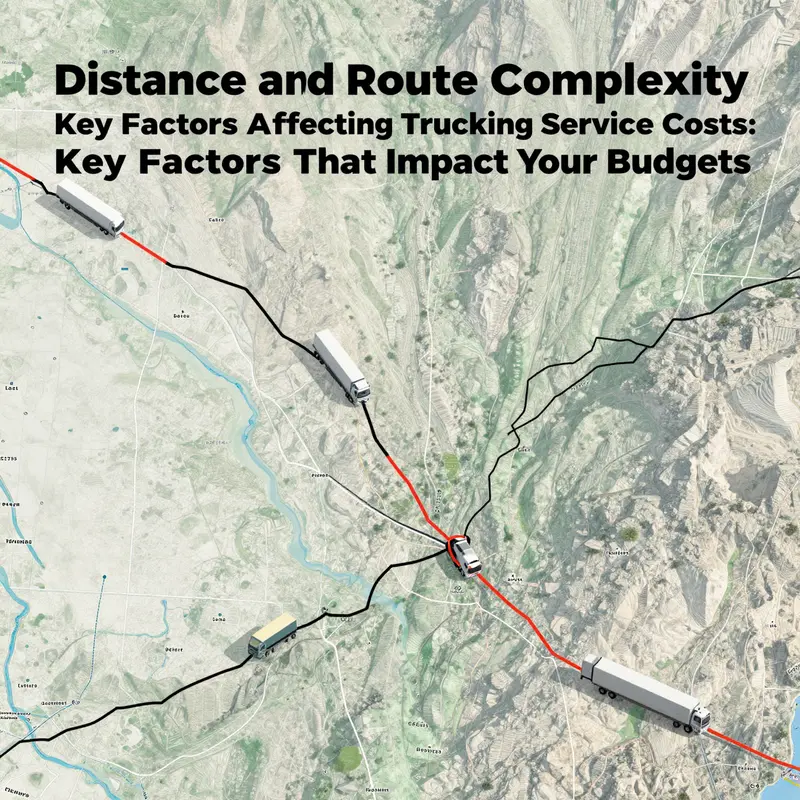
Distance and route complexity sit at the heart of trucking economics, shaping every mile you pay for and every minute you wait. When you look at a shipment, the distance is not merely a line on a map; it is the sum of fuel burned, hours logged, and the cumulative wear on the equipment roster. The route, meanwhile, is a living, breathing set of decisions—where to stop, how to navigate terrain, and when to move through congested markets or restricted access zones. Taken together, they form the most fundamental kernel of cost: the basic arithmetic of moving a vehicle from one point to another under real-world conditions. The scope of distance is straightforward yet consequential. The longer the journey, the more fuel a truck consumes, the more hours a driver spends behind the wheel, and the more wear and tear accumulates on the engine, tires, brakes, and other critical components. Even with the efficiencies of long-haul operations and economies of scale, the per-mile rate can only be stretched so far when the underlying mile count keeps climbing. In practice, long distances expose the business to a broader spectrum of inputs—tolls, overnight lodging for drivers on multi-day runs, and potential maintenance windows due to the extra fatigue the vehicle experiences after thousands of miles. The cost profile becomes a function of miles driven, but mileage is not a solitary predictor. The road itself matters, and that is where route complexity enters with force. A shipment that travels in a straight line along well-maintained highways might still be costly if it takes a roundabout path to avoid a high-toll corridor or to bypass a city’s tight urban rush. Conversely, a longer route that uses efficient corridors and avoids mountain passes can sometimes reveal a paradox: more miles, but lower overall cost per mile when fuel efficiency rises and congestion dips. In this sense, distance is not the sole driver of price; it is the combination of how far you go and how you go there that ultimately sets the bill. Route complexity compounds this effect by adding layers of time, risk, and resource allocation that do not simply add up in a linear way. Each additional stop introduces an extra calculation: the time required for pickup and handoff, the administrative overhead of paperwork, the potential need for specialized equipment, and the possibility of delays caused by traffic, weather, or gate and delivery window restrictions. If the route includes mountain passes or desert crossings, the truck’s performance is tested in different ways. Climbing grades demand more engine output and careful speed management, while descents call for precise braking strategies and air resistance considerations. Fuel efficiency can swing with terrain, weather, and load distribution, turning what seems like a straightforward mile into a more expensive segment of the journey. Urban congestion, with its stop-and-go rhythms, compounds the effect. Tight corridors, canalized routes through downtown cores, and limited loading zones all translate into extra idling time, higher drift in planned schedules, and more fuel burned per mile as the vehicle fights to sustain speed amid traffic. Each delivery window adds a scheduling constraint that the carrier must respect or negotiate, sometimes resulting in off-peak routing or expedited options to avoid penalties for late arrival. Access restrictions, such as time-based delivery slots, height and weight restrictions on certain streets or bridges, and the evolving network of curbside pickup rules, push planners to adjust route sequences and timing. In regions where regulatory or infrastructure constraints are strict, carriers may incur higher operational costs simply to satisfy compliance and maintain reliability. The sum of these factors—multiplied by the number of legs, stops, or transfers—often materializes as a measurable increase in price compared with a straightforward, non-stop highway run. The transportation industry increasingly relies on data and analytics to quantify these dynamics. A shipment that travels across state lines through mountainous terrain or densely populated metropolitan areas will naturally carry higher costs than a short-haul transfer primarily on well-maintained interstates. The risk component also scales with distance and complexity. Longer routes are exposed to more potential delays—accidents, weather-induced closures, or regulatory hold times at border crossings or in urban cores. These risks, when priced into contracts or offered as services, can push the ticket price higher to cover expedited recovery or contingency planning. The numbers behind the logic reinforce the qualitative picture. The American Trucking Associations (ATA) analyses consistently show that fuel and labor dominate operating costs, and both are sensitive to the traveling profile of a shipment. Routing inefficiencies—the misalignment of planned routes with the most efficient paths—can increase fuel usage by up to roughly 15%. That gap translates directly into a tangible cost delta across the fleet, especially when multiplied by week-after-week of similar routes. The practical takeaway for shippers and carriers is straightforward: invest in better route planning and consider how distance, terrain, and urban density interact with each other to affect total cost. A smarter route may extend a journey slightly in distance but shave hours, reduce idling, and avoid steep penalties for late deliveries or missed time windows. The planning mindset shifts from “get there fast” to “move there efficiently within constraints.” That mindset naturally leads to a more nuanced approach to choice of route, mode, and scheduling. For instance, in some cases a longer but flatter, low-traffic corridor might beat a shorter but congested path when you account for time, fuel burn, and driver hours. The interplay between distance and route complexity also interacts with market conditions. When demand is high, the premium on reliability can push prices up, especially for routes through busy metropolitan centers or across rugged geographies where compliance and risk management require more attention. Conversely, in markets or seasons with abundant capacity, even complex routes can be priced more competitively if a carrier can fill the timeline without excessive idle time. The layer of complexity adds up not just in the direct costs of fuel and wages, but in the intangible costs of planning, scheduling, and risk mitigation. A dispatcher’s time, a driver’s readiness, and the availability of appropriate equipment all contribute to the final price tag. In this sense, the cost story is a narrative of constraints and optimization: the miles themselves are a variable, but the way those miles are navigated multiplies the impact. The better a shipper and carrier can align routes with predictable demand, stable weather patterns, and streamlined access windows, the more efficient the operation becomes. This is why route planning tools, accurate ETAs, and real-time traffic and weather data are not luxuries; they are essential instruments for controlling the bottom line. For readers seeking a broader perspective on how these factors fit into the shifting landscape of trucking economics, the broader context of industry trends is informative and instructive. See the discussion on economic trucking trends for a larger view of how distance, route planning, and market cycles interact across fleets of different sizes. economic-trucking-trends. The web of influences continues to evolve as infrastructure, regulation, and technology reshape the margins that distance and route complexity carve into the cost structure. While the core idea remains simple—that more miles and more complex routes raise costs—the reality is nuanced. A well-planned route that minimizes stops, avoids high-congestion corridors, and respects time windows can yield a lower overall bill than a shorter route that squeezes through a dense urban center and incurs heavy idle time. As carriers invest in smarter routing software, more accurate telematics, and better data on road conditions and regulatory environments, the cost implications of distance and route complexity will become more precise and more predictable. This shift is not about eliminating the cost drivers; it is about understanding and managing them more effectively. The ultimate value for shippers lies in transparent conversations about what each mile costs and why certain routes, while longer, may offer a better balance of reliability, safety, and total price. In this sense, distance and route complexity are the navigational stars of trucking economics—points on a map that, when read correctly, reveal the true shape of the bill and the best path to a timely, safe, and cost-conscious delivery.
External resource: For a broader industry context and data-driven insights, consult the American Trucking Associations report at https://www.trucking.org/.
Wheels, Weights, and the Wallet: How Vehicle Characteristics Shape Trucking Costs
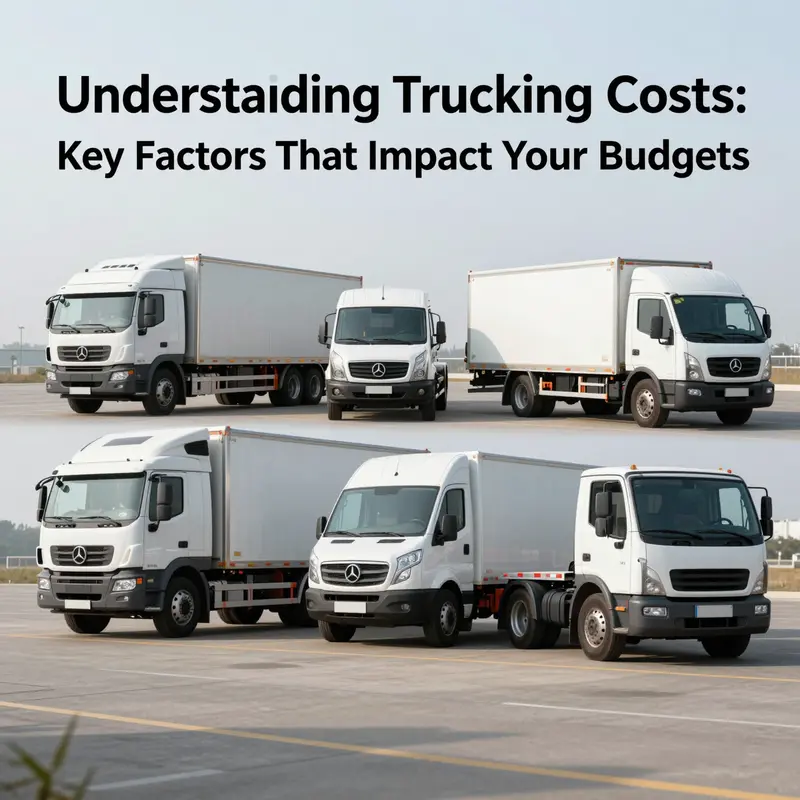
The cost of moving a vehicle or a load isn’t a mystery hidden in the broker’s ledger. It is a direct consequence of the physical attributes of the fleet that actually performs the job. In the landscape of trucking, vehicle characteristics quietly determine how efficiently a shipment can be moved, how often a route must be scheduled, and ultimately how much a customer pays. Understanding these characteristics helps illuminate why two hauls that look similar on the surface can diverge in price, and why decisions about equipment often ripple through the total cost of service long after the pickup is completed.
At the core sits the maximum permissible laden weight, a boundary that defines how much a given vehicle can legally carry. Heavier platforms can deliver more freight per trip, creating economies of scale that reduce the cost per ton or per pallet. This is almost always favorable for larger shipments, provided the freight justifies the vehicle’s payload. Yet the same heaviness compounds other costs: heavier trucks burn more fuel, wear tires and driveline parts faster, and often incur higher maintenance bills. In addition, many road networks impose tolls or access restrictions for heavier classes, which can offset the payload advantage. The result is a careful balance: the optimal choice is usually a vehicle that can carry enough weight to minimize trips while staying within the most fuel-efficient and tariff-friendly range for the route.
Load capacity, closely linked to weight, shapes the same calculation from a slightly different angle. When a truck’s capacity aligns with the volume of the shipment, the operation benefits from space utilization, reducing empty space and preventing underutilization penalties. Misalignment, however, is the sneakiest cost driver. A large, underfed vehicle can end up transporting only a fraction of its potential load on a given run, pushing the cost per unit higher than it would be on a smaller, precisely matched rig. This is not a theoretical concept but a practical discipline in planning: fleet managers continually weigh the freight profile against the truck’s interior geometry, the number of axles, and the constraints of the trailer type to ensure that every mile carries maximum value.
Age of the vehicle is another pivotal factor. As trucks age, maintenance tends to grow and reliability can waver. Older engines and drivetrains may require more frequent service, which translates into higher maintenance expense and increased risk of delayed pickups or deliveries. Fuel economy often declines as well, even when an operator takes pains to maintain the vehicle. These factors can push up insurance premiums and maintenance reserves in the pricing model, because carriers need to hedge against the cost volatility that comes with aging equipment. In markets with stringent emissions standards, aging fleets may also face higher compliance costs, fines, or route exclusions, all of which elevate the total cost of service if a plan relies on older assets.
Axle configuration sits at the intersection of safety, legality, and efficiency. The number of axles, their spacing, and their load distribution govern not only how much weight a vehicle may carry on specific roads but also how fuel-efficient it is in real-world conditions. A well-suited axle arrangement aids stability on uneven terrain and improves braking and handling, which reduces the likelihood of accidents and the consequential costs of claims, downtime, and repairs. It also determines permissible weight on different road segments, with some corridors restricting heavier configurations to protect bridges and pavement. The upshot is that a vehicle’s axle design is a critical constraint that can either enable a cost-effective load plan or force more expensive detours or additional equipment to meet legal requirements.
The interplay of these vehicle characteristics with market dynamics is where the pricing mosaic truly comes into focus. Logistics providers are not simply selling a lift from point A to point B; they are applying a complex calculus that weighs payload capacity against fuel consumption, maintenance overhead, and regulatory exposure. When demand is high and capacity tight, the cost pressure on carriers rises, and the price for heavier vehicles or specialized configurations may climb further due to the scarcity of suitable equipment. Conversely, in periods of abundant capacity or for shipments that can be matched with mid-range trucks designed for efficiency, the per-unit cost can come down, highlighting the importance of route choice and equipment matching.
The regional dimension also matters. In the European context, for example, the relationship between weight classes and overall road freight activity reveals a nuanced reality: vehicles in the 10.1 to 20.0 tonne class accounted for about 10.9% of EU road freight, while the 20.1 to 30.0 tonne segment contributed roughly 5.8%. These figures underscore that weight classes are not only a measure of payload but reflect broader patterns of how fleets are deployed to meet diverse freight needs. This trade-off—payload versus enhanced fuel use, higher maintenance demands, and possible tolls or route restrictions—appears repeatedly in real-world pricing discussions. It is not simply about moving more weight; it is about moving it in the most cost-efficient way within the regulatory and physical constraints of the corridor being served.
To translate these dynamics into practical decisions for customers, consider the impact on shipment planning. If a supplier can consolidate multiple smaller loads into a single, heavier payload, the number of trips is reduced, and the burden of repeated driver wages, fuel, and tire wear is lowered per unit of freight. Yet not all loads justify a heavier configuration. A shipment with a fragile commodity may require an enclosed trailer or a specialized suspension, which shifts the cost calculus. Vehicle age also feeds into this decision: a modern, well-maintained fleet with favorable fuel efficiency and reliable uptime can command a premium for expedited or guaranteed delivery windows, but it also tends to provide steadier, predictable pricing over a contract period. In contrast, a mixed fleet with a broader age range offers flexibility but can introduce variability in maintenance-related disruptions and fuel consumption, which must be priced into bids and service level agreements.
One area where vehicle characteristics intersect noticeably with future cost trajectories is fleet electrification and the broader push toward alternative powertrains. The weight of batteries, the need for thermal management, and the different performance envelopes all influence payload capacity and route feasibility. In markets exploring new entrants and pilots, the Harbinger Electric Trucks Canada Market Entry case offers a tangible example of how electrification can reshape planning assumptions. It illustrates that electrified or hybrid configurations may alter the balance between payload and range, prompting a redesign of cost models to reflect battery weight, charging time, and the potential for lower per-mile energy costs during certain conditions. For readers curious about how such developments are evolving, this perspective is a timely reminder that vehicle characteristics are continually evolving as technology advances. Harbinger Electric Trucks Canada Market Entry
Even with the most favorable physics of loading and payload, the choice of a given vehicle type is never made in isolation. Customer demands, service levels, and route realities all push the decision toward specific configurations. Open, unshielded transport is the most economical for many metal- or commodity-type freight where weather exposure is not a primary concern. Enclosed trailers, though costlier, offer better protection for high-value or sensitive cargo, potentially reducing insurance costs and claims. The decision to favor a specialized vehicle—such as a heavier stake bed for outsized loads or a low-bed for construction equipment—reflects a precise judgment about risk, speed, and reliability. Each choice maps back to the bottom line: the more tailored the vehicle to the shipment, the more predictable and potentially lower the total cost becomes over the life of a contract.
The conclusion is not that one class of vehicle is universally superior, but that the optimal configuration is highly context dependent. A shipment planner who can align payload capacity with actual freight volume, while respecting legal weight limits and anticipated route conditions, often achieves a lower cost per unit than a plan driven by convenience or familiarity. Seasonality and demand cycles further complicate the picture. In peak periods when drivers are scarce, carriers may pool loads into more efficient configurations to maximize utilization and protect margins. In off-peak times, flexible pricing and longer lead times can translate into savings for customers who can adjust delivery windows to those quieter periods.
Taken together, vehicle characteristics are a core lever in the pricing machinery of trucking services. They influence fuel burn, maintenance costs, insurance exposure, and the degree of regulatory risk a carrier must bear. They also shape the practical realities of scheduling and route design, which can either compress or expand the time and distance required to move goods. The objective for customers and carriers alike is to strike the right balance: select equipment that matches the shipment’s weight and volume, minimize idle capacity, and stay within the most cost-efficient operating envelope for the chosen route. When done well, this alignment not only reduces the price tag but also improves reliability, speed, and risk management across the transport chain. For those who want to explore the statistical underpinnings of how weight classes relate to road freight in Europe, see the official statistics on road freight transport by vehicle characteristics for a data-grounded perspective. The external resource provides a detailed, formal view of how weights and load profiles translate into regional freight patterns and policy considerations. https://ec.europa.eu/eurostat/statistics-explained/index.php/Roadfreighttransportbyvehicle_characteristics
Modes, Speed, and Margin: How Transportation Method and Velocity Shape Trucking Costs
In the economics of trucking, the choice of transportation method and the pace at which shipments move are core cost drivers. They shape fuel burn, driver hours, equipment wear, and the risk profile that underpins insurance and liability. When a shipper moves freight, they are selecting a vehicle type and a tempo, which sets the framework for nearly every line item on the invoice. The basic rule is simple: faster and more specialized modes tend to have higher fixed and variable costs, but they may be necessary to meet windows or protect valuable cargo. Slower, higher utilization configurations can lower per unit costs if load factors stay high and routes are efficient. The key is balancing speed, protection, route complexity, and utilization to achieve value rather than simply chasing the fastest option.
To understand how method drives cost, consider common truck configurations. A standard dry van offers reliable payload and reasonable operating costs. A refrigerated trailer adds cooling power, higher fuel use, and extra maintenance. Flatbeds and specialized heavy haul switch the calculus again with different loading times, risk considerations, and capital needs. Each choice changes payload density, handling time, and the cargo risk profile, all of which feed into the overall price.
Load capacity and efficiency matter because fixed costs such as driver wages, insurance, and depreciation are spread over more or fewer units. Larger vehicles can reduce per unit cost when utilization is high, but underutilization inflates the per unit burden. Conversely, in cities or on complex routes smaller, more agile equipment can be advantageous, though per unit costs may rise due to underutilization.
Fuel efficiency remains a central lever. Modern tractors with aerodynamic features burn less fuel, especially at reasonable speeds. Powertrain, gearing, and trailer design can create meaningful differences in fuel burn over long hauls. Refrigeration units add to the burden of fuel and maintenance. The math is about marginal costs: the extra fuel for higher speed must be justified by greater revenue from quicker deliveries or higher load capacity.
Speed also interacts with maintenance, wear, and insurance. Higher speeds increase drag, reduce miles per gallon, and raise maintenance needs. They can, however, unlock earlier loading windows, reduce dwell in hubs, and allow more trips per day. The optimal choice depends on whether value comes from time savings, higher asset utilization, or a balance of both. In practice, fleets tune speed caps to reflect road risk, weather, and market conditions.
The decision between open and enclosed transport adds another layer. Open trailers generally cost less per mile but expose cargo to weather and require fewer protective measures. Enclosed trailers protect high value or sensitive loads but add weight, cost, and sometimes extra handling time. The best option depends on cargo value, risk tolerance, and required delivery windows. In some cases, the speed choice and the mode together determine the risk profile and the protection level that is included in the price. In other cases, the same cargo could be transported more economically on an open trailer with spacing or scheduling adjustments. The important takeaway is that the speed and method are not isolated levers; they combine to determine a package’s risk profile and its protection requirements, and those factors drive the price.
Finally, seasonality and market conditions can amplify or mute these effects. Peak periods can raise the value of flexible capacity and push shippers toward modes that maximize load efficiency, even if that means slower transit. Off peak windows may allow discounts as carriers compete for capacity. This dynamic underscores the value of planning and data driven decision making. Tracking load factors, dwell times, and fuel burn across modes helps renegotiate terms and adjust operations in real time.
The bottom line is that mode and speed are intertwined drivers of trucking cost. They determine how efficiently a fleet uses fixed assets, how much fuel is burned, how fast maintenance cycles arrive, and how risk is priced into the quote. The best cost outcomes come from a fit between shipment characteristics, route realities, and disciplined pace and protection, not from a single factor in isolation.
Riding the Freight Wave: How Market Demand and Seasonal Cycles Shape Trucking Costs
Demand and seasonality are less like background forces and more like the weather systems that shape every mile a truck travels. In the trucking world, the price of moving goods is not just about distance or the size of the load; it rises and falls with how many ships want to move freight, how fast they want it done, and what time of year it is. To understand trucking costs, one must follow the pulse of market demand and the predictable ebbs and flows of seasonal activity. When demand surges, capacity tightens; when it eases, rates soften. The result is a dynamic pricing landscape where the same route can cost more in one month and less in another, driven by the same fundamental rule: pricing is a reflection of scarcity and urgency as much as it is of weight or distance.
Seasonality threads through every facet of freight pricing. Retail cycles, holidays, harvest periods, and school-year schedules all create predictable peaks and valleys in shipment volumes. The late-year retail push, for instance, squeezes lanes toward capacity as orders accumulate and warehouses scramble to replenish shelves before the holidays. The effect is a congestion of demand that ripples along the highway system, into distribution hubs, and all the way to the carrier’s compiler of timelines and quotes. This isn’t mere chance; it is a recurring pattern that carriers incorporate into their pricing and service offerings. Slower months, by contrast, often prompt carriers to loosen up on rates to keep assets turned and drivers employed. The dance between high-demand surges and low-demand lulls is the rhythm that shapes the price-per mile, the availability of expedited options, and the overall cost envelope a shipper encounters.
To see why demand matters so much, imagine the capacity market as a finite set of trucks, drivers, and loading windows. Each carrier has a fixed number of hours in a day, a fleet size, and a roster of qualified drivers. When shipments flood the market, there are more loads than there are available trucks and drivers. The result is not simply higher rates; it’s a recalibration of what the market will bear, a recalibration that appears in several forms. First, premium wages become commonplace during peak periods as carriers compete to attract scarce talent for longer hours or more demanding routes. Second, shippers often encounter expedited services or dedicated lanes that command a premium because they promise speed and reliability in a tight supply environment. Third, there is a broader, indirect price pressure: with capacity scarce, carriers may levy higher accessorial charges for things like dedicated time slots, extended waiting, or special handling. In short, demand drives the cost structure by translating utilization rates into a premium for time, certainty, and space.
Seasonality also amplifies the influence of route complexity and timing. The same highway segment can behave very differently depending on whether it’s peak season or a lull. During peak cycles, highways and interchanges experience more congestion, which translates into longer drive times and higher fuel burn. Increased transit time raises driver wages attributable to idle time and overtime, and it elevates the risk of delays at transloading points or border crossings in some regions. This is a compounding effect: longer trips mean higher exposure to weather, traffic, and regulatory checks, each adding a layer of cost that carriers price into the quote. Conversely, in off-peak periods, capacity tends to loosen. The flip side of that advantage is that carriers must still cover fixed costs—insurance, maintenance, regulatory compliance—so they often adjust rates carefully to maintain asset utilization without leaving money on the table. The result is a market in which performance guarantees, reliability, and predictability carry a price premium during busy times, while time and space can be negotiated more aggressively when the lanes are quieter.
Strategic planning becomes crucial when market demand and seasonality push freight rates higher. For shippers, the lesson is not to chase the cheapest quote in a single moment but to anticipate cycles and align procurement with projected demand ripples. Forecasting tools, demand signals, and supplier calendars matter because they help a business lock in capacity during known peak windows or secure more favorable terms during slower periods. The same logic applies to the negotiation posture. If a company can forecast that a particular season will intensify demand on specific lanes, it can negotiate longer-term contracts or volume commitments with carriers, receiving steadier rates and more predictable service in exchange for guaranteed throughput. For carriers, the ability to smooth utilization across the year—by offering flexible options, multi-stop routes, or bundled services—can reduce exposure to sudden spikes in seasonality. In doing so, they can maintain a steadier revenue stream and improve asset utilization, even as the market swings.
The broader economic backdrop informs the intensity of seasonal cycles. Consumer spending, manufacturing activity, and global trade flows all modify the calendar of demand. When consumer confidence is high and inventories run low, retailers and manufacturers push more freight into the system. When manufacturing slows or supply chains recalibrate after disruptions, demand softens and capacity becomes more abundant. These macro signals do not replace the obvious seasonal patterns; they amplify or dampen them. For example, a robust holiday season can push freight rates higher than usual, even on routes that historically see moderate volumes. Conversely, a sudden period of weak demand can trigger lower utilization and more aggressive bidding among carriers hoping to fill the gaps. The interplay between macroeconomic trends and seasonality creates a tapestry of pricing that is as much about timing as it is about distance.
One practical implication for anyone managing a trucking budget is to treat seasonality as a calendar you can plan around, not a force you must endure. If you can forecast when lanes will tighten, you can secure capacity in advance, choose routes that balance speed with price, and perhaps avoid premium charges that come with last-minute changes. Similarly, flexible scheduling can yield dividends. In many markets, moving shipments a week earlier or later in a peak season can tilt the cost equation in favor of the shipper without sacrificing service levels. For those who must move critical loads during busy windows, tiered service options offer a way to balance urgency and cost. Shared-load or cage services, which distribute a shipment across multiple customers’ freight, can offer reduced per-unit costs during high-demand periods, provided your timing and routing align with the shared network’s capacity.
To connect these ideas to a broader framework, consider how the discipline of logistics pricing weaves together demand, capacity, and timing. The internal logic resembles a weather forecast: when demand indicators rise, prices trend up; when capacity becomes plentiful, prices ease. It is not a single lever but an orchestration of factors—driver availability, fuel costs, tolls, maintenance schedules, and the predictable rhythms of consumer behavior. This is why, even with identical miles and weights, two shipments can carry different price tags simply because one aligns with a peak season and the other sits in a lull. Shippers who understand this alignment, who can place orders with an eye on the calendar, often achieve more stable costs and fewer surprises.
For readers seeking a broader lens on how these market dynamics evolve, consider the discussion of economic trends that influence trucking. A concise overview of these shifts helps explain why demand responds to things like wage levels, energy prices, and trade policy as much as to seasonal calendars. For additional context, see the article on Key Economic Trends Impacting the Trucking Industry, which delves into how these forces shape capacity and pricing across the year. Key Economic Trends Impacting the Trucking Industry.
Finally, the seasonal rhythm of freight has practical implications beyond quotes and contracts. Shippers who build in buffers for peak periods, who diversify lanes, and who collaborate with carriers on capacity planning can navigate the surge periods with more resilience. Conversely, during slower periods, they can leverage the opportunity to improve service levels, consolidate shipments, or renegotiate long-term terms while capacity is more abundant. The upshot is clear: market demand and seasonality do not just affect the price of a single shipment; they shape the entire strategic approach to how a company moves goods. When understood and anticipated, these patterns become levers for cost efficiency rather than sources of cost volatility.
External resource: for a contemporary perspective on how holiday-season dynamics can lift freight rates, see the Bloomberg article on trucking market activity during peak periods. https://www.bloomberg.com/news/articles/2023-10-17/trucking-market-gets-busy-as-holiday-season-approaches-boosting-freight-rates
Final thoughts
Navigating trucking service costs requires a robust understanding of the factors at play. By recognizing the implications of distance, vehicle types, transportation methods, and market dynamics, businesses can strategize effectively to manage and potentially reduce their shipping expenses. Adapting shipping practices based on these insights not only enhances budgeting accuracy but also ensures smoother operations and better service delivery.